

Data Analytics
Simplifying Data in the Age of AI
Are AI dashboards overwhelming users with too much data? Discover why simplifying data into clear, actionable insights is the future of better product design.
 Sachin BhatnagarChief @ StackSauce7 min read
On this page7 sections
Why Less Data Might Be Exactly What We Need
We live in an age of excessive data and minimal attention spans. Every new startup seems to promise a fancy AI-powered report or dashboard. More charts, more graphs, more insights.
When More Information Becomes Less Useful
Take AI interview and assessment products, for example. Many generate elaborate reports with graphs, scores, and 20 to 30 bullet points of feedback. There's so much information that the average user barely knows where to begin.
Imagine you're a student who has just completed a mock interview. You open your assessment report and find scores for communication, technical accuracy, confidence, problem-solving, vocabulary, sentence structure, and a dozen other parameters. There are radar charts, percentile rankings, colour-coded indicators, and several paragraphs explaining where you went wrong.
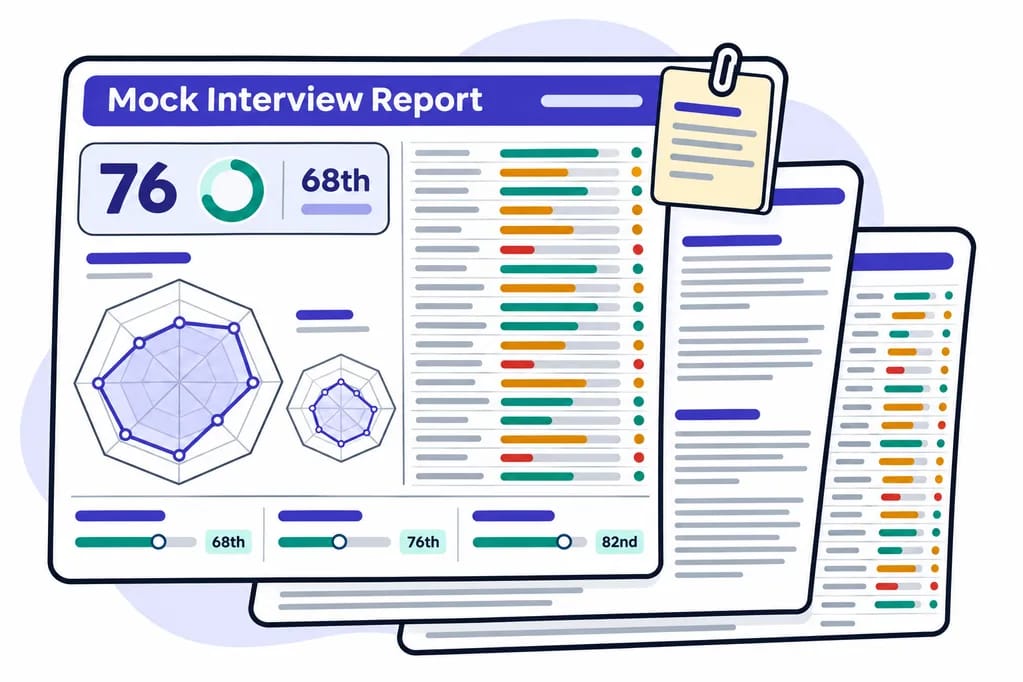
You spend ten minutes going through it, close the report, and get on with your day.
Now imagine the same report told you just three things:
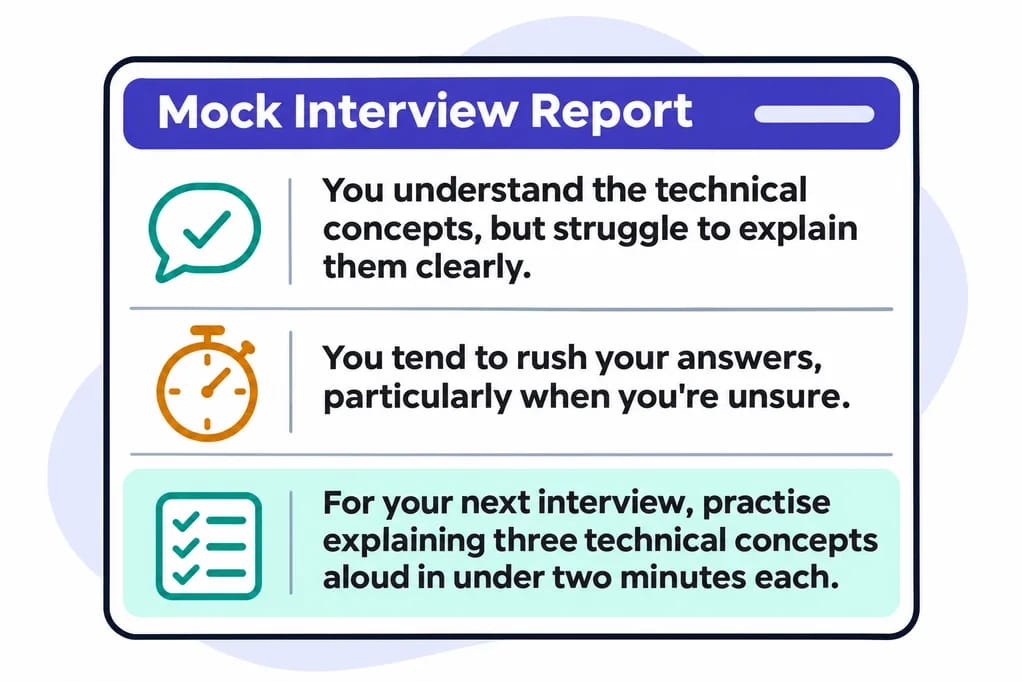
Which report is more likely to help you improve?
The first report might be an impressive demonstration of the product's analytical capabilities. The second actually tells you what to do.
But here's a question worth asking:
Can your audience actually comprehend all the data you're presenting? More importantly, do they even bother?
The Art of Knowing What to Leave Out
I think data analysts and product builders need to learn the art of reduction. It's a skill that doesn't get nearly enough attention.
And reduction is not the same as removing information. It's about understanding what matters, what doesn't, and what deserves the user's attention right now.
In fact, I'd argue that deciding what not to show requires just as much intelligence as deciding what to show.
Think about how we consume information in everyday life.
When you visit a doctor with a blood test report, you don't necessarily want a detailed explanation of every parameter printed on those pages. You want to know whether something is wrong, how serious it is, and what you should do next. The individual numbers matter, of course, but their real value comes from someone interpreting them in the context of your health.
Or take your electricity bill. Most people don't care about the elaborate breakdown of consumption across different periods, taxes, surcharges, and tariff calculations. They want to know how much they owe, when it's due, and perhaps why the amount is unusually high this month.
The underlying information is important. But its importance doesn't automatically mean that every piece of it deserves equal prominence.
For most consumers, a few clear, meaningful takeaways are far more valuable than pages of data, however beautifully presented.
What If Dashboards Told Us What Actually Matters?
Fancy graphs and dashboards had their moment. They're still useful, but I think we've reached a point where we need to rethink how we present information.
I'd much rather open a dashboard and read:
"Sales are up 30% this week compared to last week, but are still slightly below the same period last year."
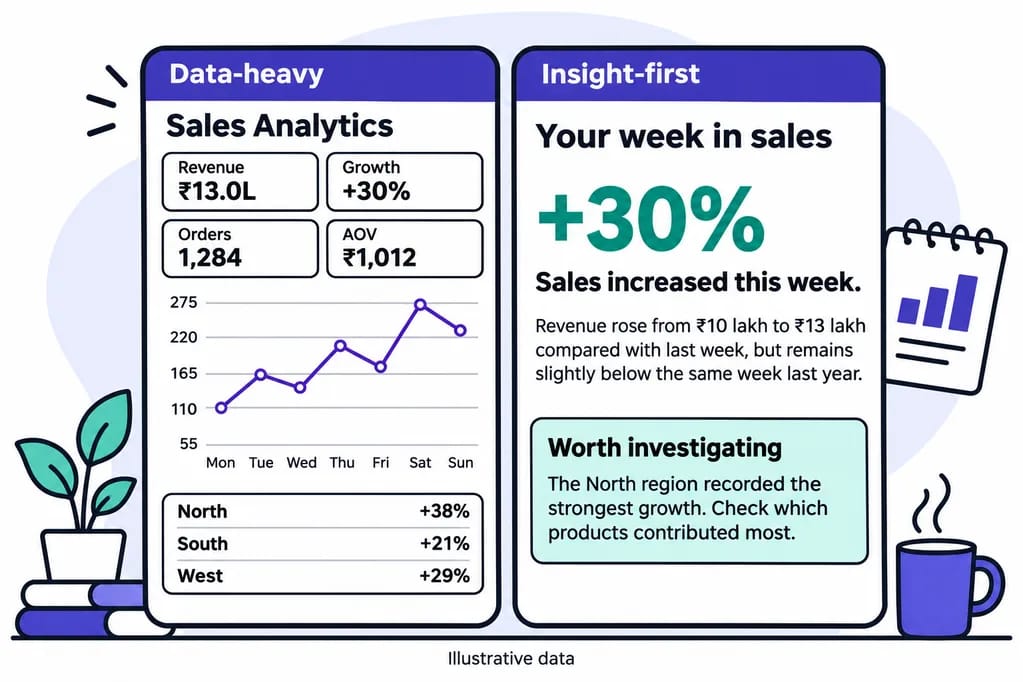
That's it. That's the first layer.
The charts, breakdowns, comparisons, and underlying numbers can sit below it for those who want to dig deeper.
And perhaps the next layer could explain why sales are up. Was there a promotion? Did an existing product suddenly become popular? Did one particular region contribute disproportionately to the growth?
You could then investigate further, but only if you wanted to.
Consider another example from education.
Suppose you're running an online learning platform with thousands of students. Your analytics dashboard tells you that course completion is at 62%, average watch time is 18 minutes, quiz accuracy is 71%, and student engagement has fallen by 12% over the past fortnight.
Useful numbers, certainly.
But what if the dashboard instead opened with:
"Students are dropping out most frequently after Module 4. Those who complete Module 5 are significantly more likely to finish the course. Consider reviewing the difficulty and length of Module 4."
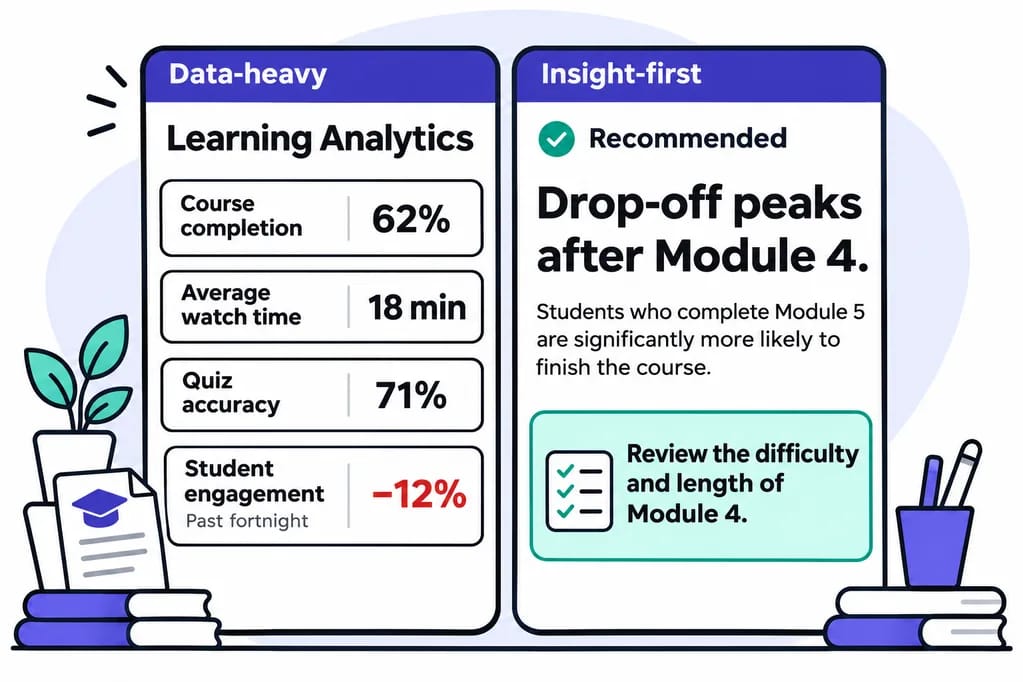
Suddenly, the information becomes useful to the person making decisions.
Of course, the system would need sufficient evidence to support that conclusion. A correlation alone doesn't establish why students are leaving. But even identifying the pattern and suggesting where to investigate would be more useful than making someone interpret a dozen disconnected charts.
From Displaying Data to Understanding It
That's the distinction I find interesting. We're very good at building products that display information. We're not nearly as good at building products that help people understand it.
And this is where AI can genuinely make a difference. It can take mountains of data and distill them into something a person can understand in seconds.
For years, building sophisticated analytical systems meant spending enormous amounts of time on data pipelines, statistical calculations, visualisations, and reporting interfaces. We invested heavily in making information available, searchable, and visually appealing.
Now we have technology that can potentially do something more valuable: interpret that information, identify meaningful patterns, and explain them in ordinary language.
Imagine a small business owner opening their accounting software on a Monday morning.
Instead of being greeted by six charts and a collection of financial metrics, they're told:
"Your revenue is healthy, but customers are taking longer to pay. Three large invoices are overdue, which could affect your cash flow later this month."
That's useful. It's specific. And it gives the business owner a reason to act.
The same principle could apply to fitness apps, personal finance tools, employee performance systems, customer support platforms, and almost any product that deals with data.
Simplification Shouldn't Come at the Cost of Accuracy
There is, however, an important distinction between simplifying information and oversimplifying it.
A good summary shouldn't hide uncertainty, ignore inconvenient facts, or manufacture explanations that the data cannot support. If the system doesn't know why something happened, it should say so.
And the user should always be able to inspect the underlying information.
That's why I like the idea of presenting information in layers. Start with the conclusion or the most important observation. Allow the user to explore the supporting evidence. And keep the raw data available for anyone who needs to examine it.
A CEO, a data analyst, and a department manager might all look at the same dataset, but they don't necessarily need the same view of it.
The CEO might want to know whether the business is moving in the right direction. The manager might want to understand what's causing a particular problem. The analyst might need to examine individual transactions, anomalies, and statistical relationships.
One dataset. Different questions. Different levels of detail.
The Future of AI Products Is Clarity, Not Complexity
The real opportunity for AI products lies in making information easier to consume, rather than generating more of it.
And I suspect this will become an increasingly important differentiator between products.
When everyone can generate a dashboard, generating another dashboard is hardly an achievement. When everyone can produce a detailed assessment report, the length and complexity of that report cease to be impressive.
What matters is whether the person using your product walks away knowing something they didn't know before, and whether that knowledge helps them make a better decision.
In fact, I think we should start asking a different question when designing data-heavy products.
Instead of asking, "What else can we show the user?", perhaps we should ask, "What is the least amount of information this person needs to make a good decision?"
It's a much harder question to answer.
Because reducing information requires you to understand the data, the audience, and the decision they're trying to make. You can't simply throw everything onto a screen and hope that the user figures it out.
That, in my opinion, is where the heart of your product should be.
Simplify. Then simplify some more.
And when you think you've simplified enough, take another look.
Topics

Written by
Sachin B
Chief @ StackSauce
Founder at Studio 8 Collective
Sachin Bhatnagar is a developer, technical educator, and industry expert with more than 22 years of experience across software development, technical education, and media and entertainment. His time in media and entertainment included work in animation and visual effects. He taught his first class in 2002. Since then, Sachin has built software, designed technical programs, and taught learners at different stages of their careers. He has worked with some of the most prestigious organizations such as Maya Academy of Advanced Cinematics (MAAC), Frameboxx Institute of Emerging Media, SitePoint Premium, Udemy, upGrad KnowledgeHut, and PhysicsWallah. He founded StackSauce to help people learn technology with more clarity and confidence. His approach is simple. Start with what learners already know, explain why things work, and give them a chance to build something of their own. He believes even a difficult idea becomes easier to explore when you have a clear place to start. Based in Chandigarh, Sachin enjoys writing, tinkering with electronics, and taking on DIY projects. He’s an aspiring drone pilot and is often at the polo ground, cheering on his daughter as she plays arena polo.